Mappings and production stack traces
Select a release mapping and resolve overloaded or inlined frames.
Browse a mapping#
Open ProGuard/R8 mapping.txt, yGuard rename_log.xml, or Allatori log.xml in the mapping viewer. Search between original and transformed names. Verify source module and signature when several classes or overloads look similar.
A simplified ProGuard-style mapping illustrates the relationship:
com.example.OrderService -> a.b:
    int calculate(int) -> a
This is teaching input, not a complete mapping for a shipped application. Real line-number/inlining information is needed for precise frame reconstruction.
Retrace the exact release#
Open Stack Trace Retrace or the Analyze → Stack Trace integration. Choose the mapping generated by the exact build that produced the trace, paste the obfuscated trace, and retrace. Review the original frames and navigate to their source.
Another version’s mapping can produce plausible but incorrect names. Do not choose a file solely because its date is close; identify the actual application version/build and artifact.
Inspect complex frames#
The built-in mapping parser handles overloads, inlining, and original line mappings. A trace can still lack enough information to identify one original location. Compare source revision and output identity before treating a surprising frame as a parser bug.
Keep release evidence#
Archive mappings with minified artifacts and module identity. A current local rebuild is not an adequate replacement for a mapping lost from a production release. When sharing a trace or report, include only the application context the recipient needs.
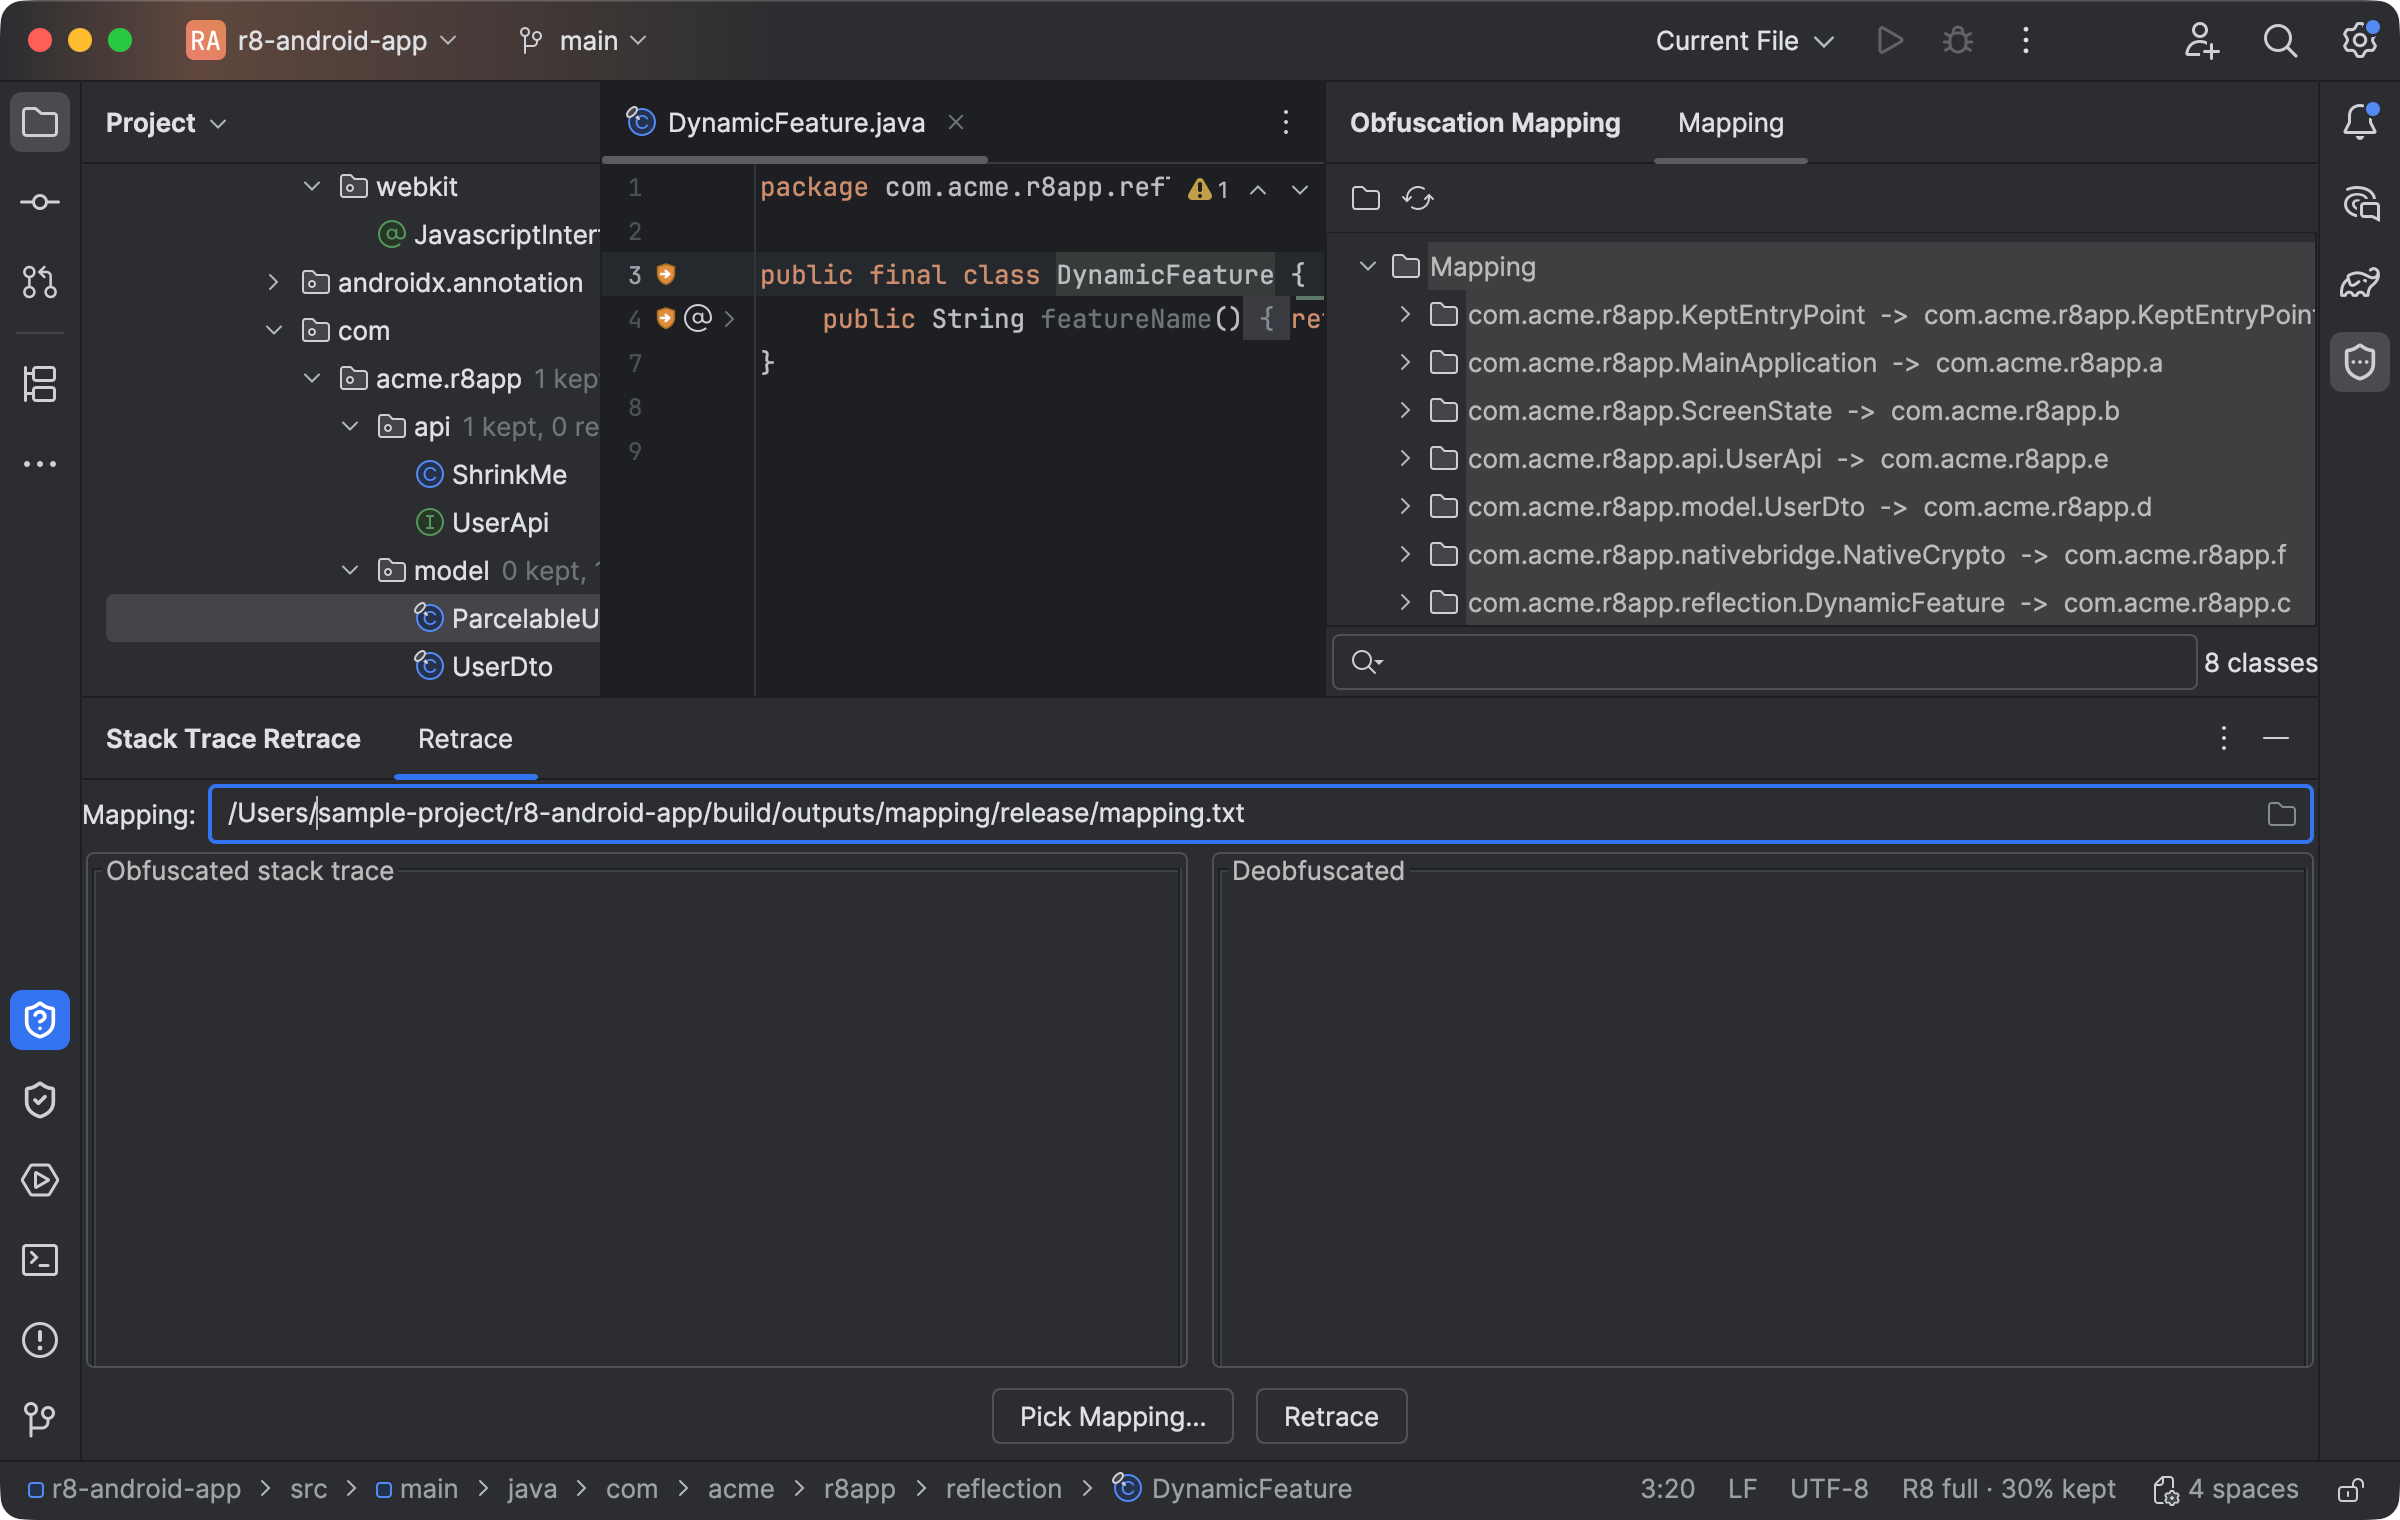
The retrace workspace selects a mapping and separates obfuscated input from deobfuscated output. Select the image to view it at full size.
Manual for version 2026.2.2 · Reviewed