LLDB debugging and the REPL
Use a debugger-capable SDK and inspect execution in the right environment.
On this page
Check debugger capability first#
Use a Pixi-based SDK containing lldb-dap, the Mojo LLDB plugin, and visualizers for file debugging. A uv/Python-wheel SDK can support editing and running without supporting file debugging. Installing another IDE debugger plugin does not add missing SDK assets.
Debug a local file#
Run the program normally, set a breakpoint on an executed expression, then choose Debug. Inspect frames, variables, and watches and use stepping to compare intermediate values. Check generated artifacts and source identity if breakpoints remain unbound.
The plugin uses the SDK’s LLDB DAP transport for CPU debugging. SDK layout and version matter independently of whether native source parsing works.
Use the REPL for focused exploration#
Open Mojo REPL and inspect its selected SDK/status. Evaluate a small supported expression or function interactively before moving it into the program. A REPL’s working directory and environment can differ from a file run configuration; imports should be checked in both contexts when they disagree.
Keep compatibility visible#
When a project uses an unsupported older SDK, update/select the environment deliberately. Compatibility warnings appear in settings, project structure, editor notifications, validation, and REPL status. Preserve a project’s supported legacy environment when necessary rather than assuming a global SDK update is harmless for every workspace.
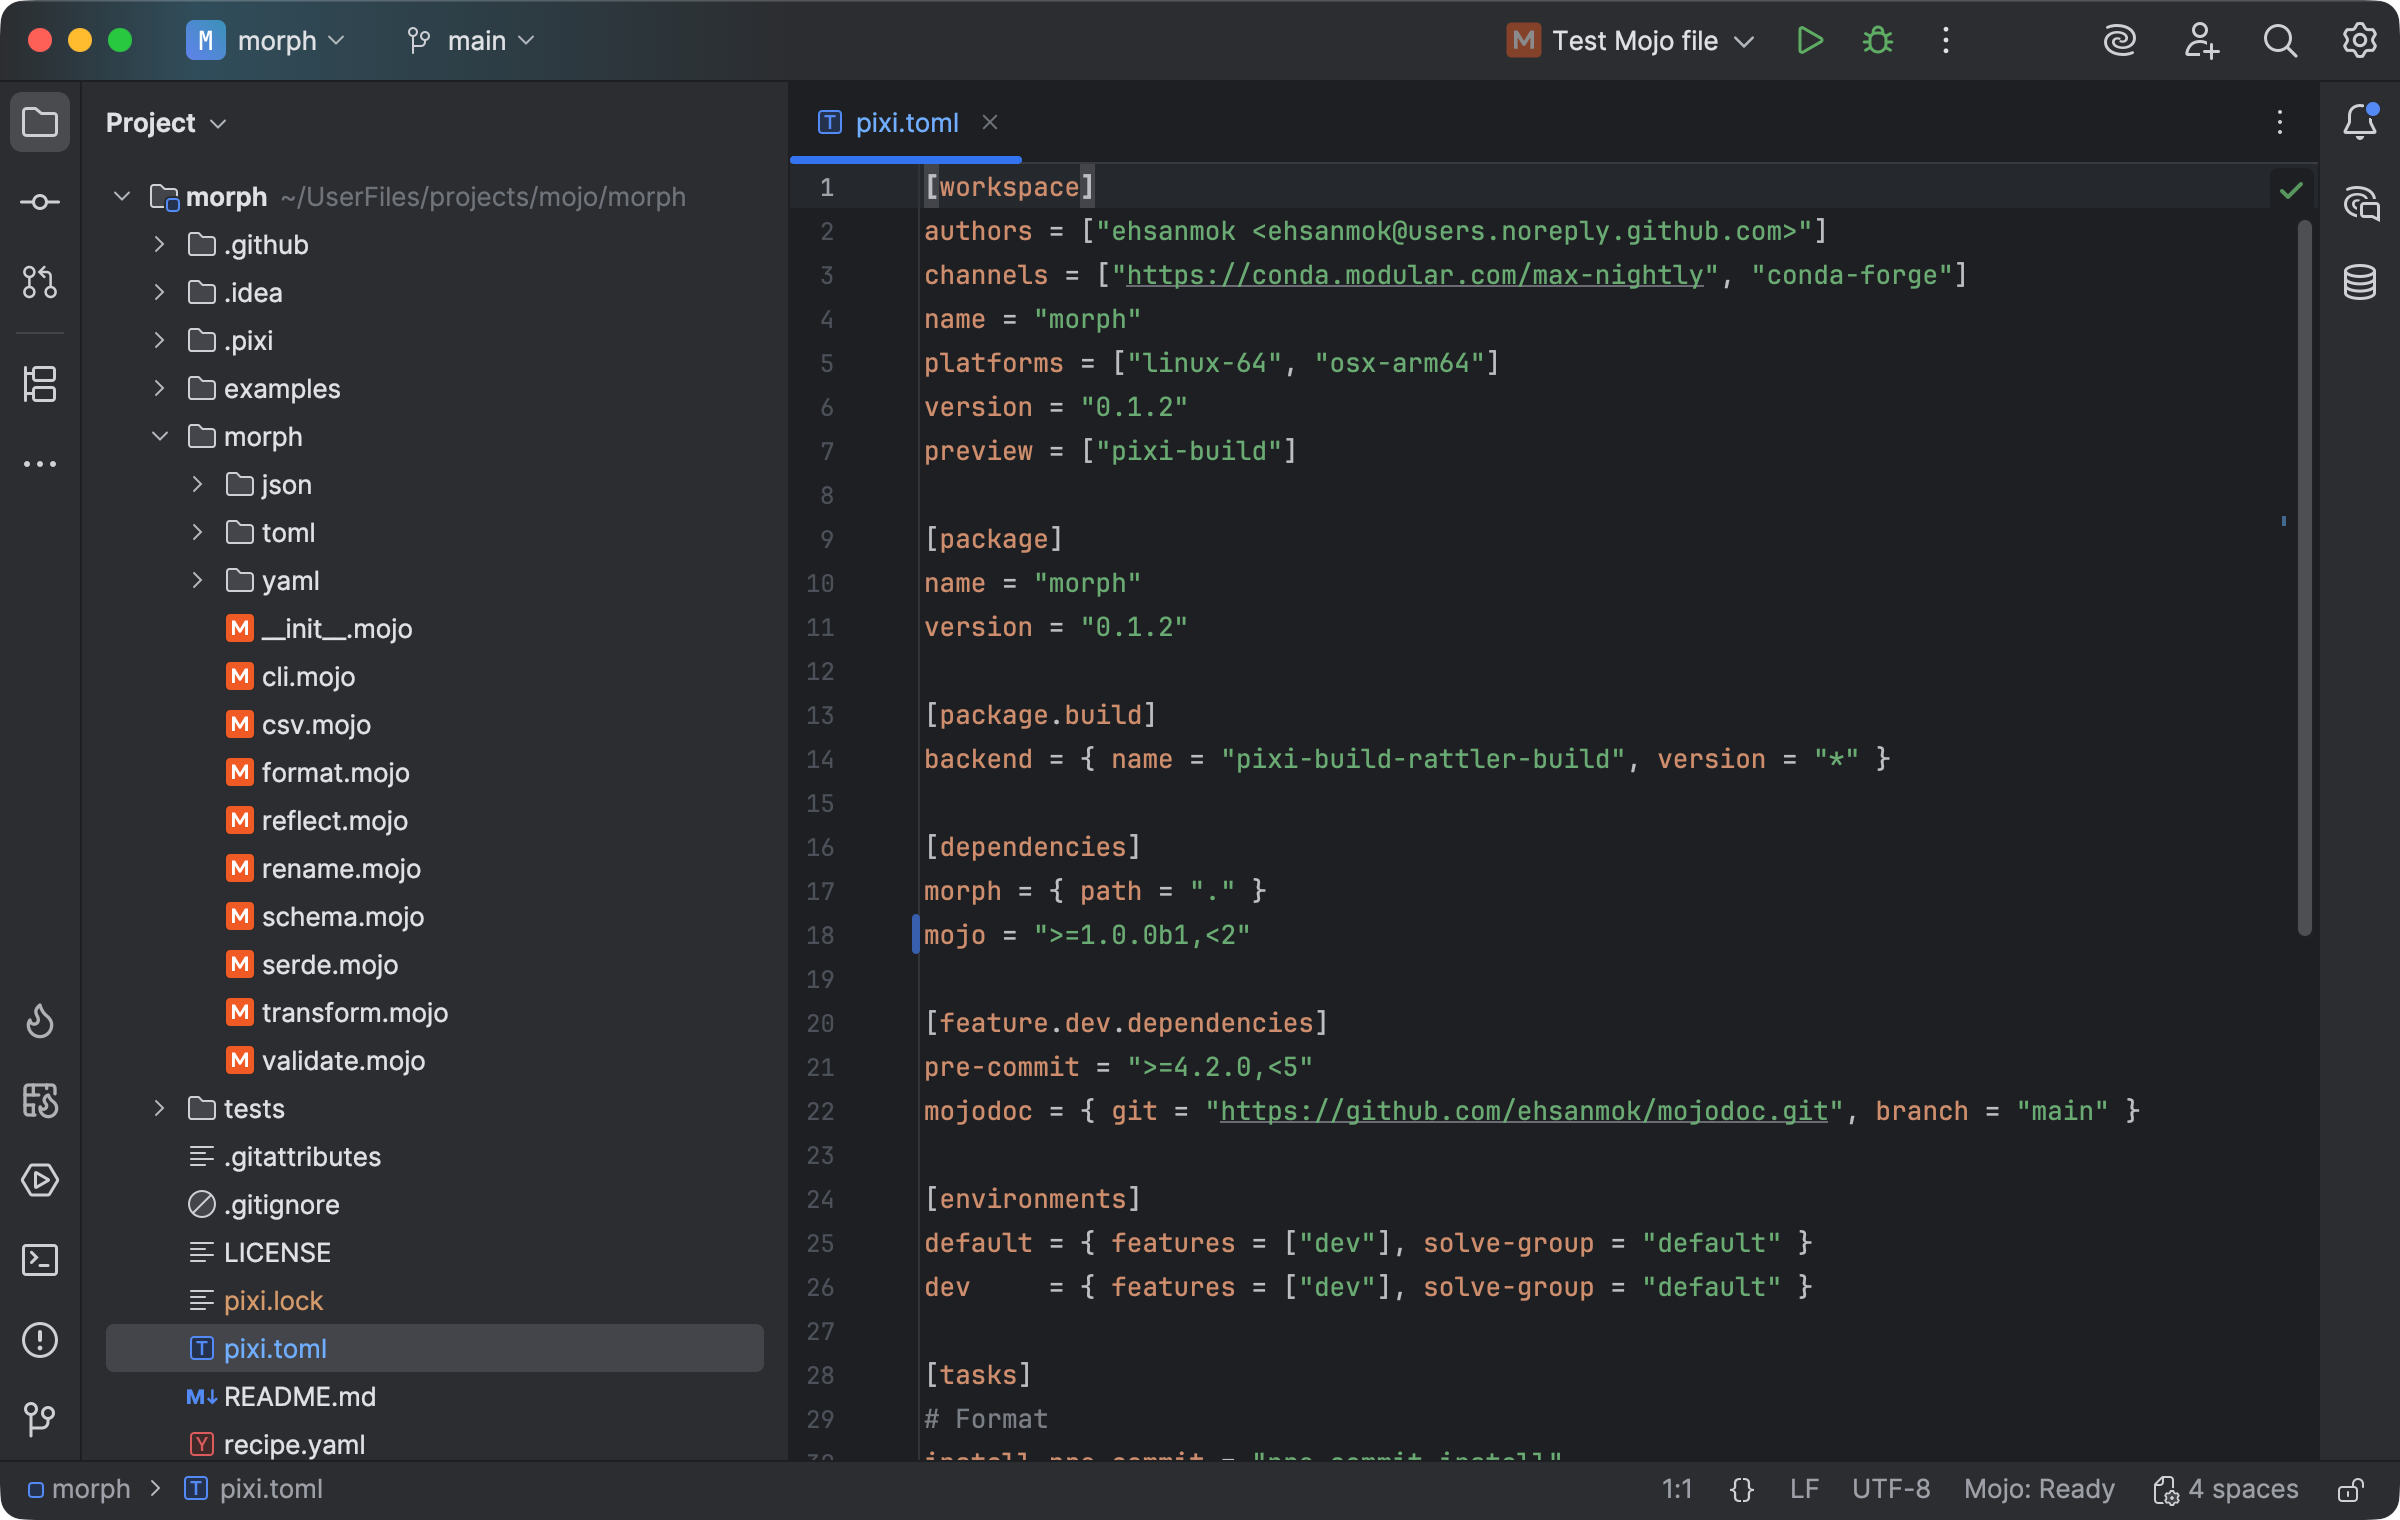
A Pixi manifest identifies the project environment and Mojo dependency used by the IDE. Select the image to view it at full size.
Manual for version 2026.1.12 · Reviewed