JavaScript source debugging and export
Bind Gleam breakpoints to generated JavaScript and inspect values.
Enable the source-map contract#
Use Gleam 1.16 or newer and add:
[javascript]
source_maps = true
Choose a JavaScript-target run configuration and an installed Node/Deno/Bun runtime. Configure a compatible JavaScript debug adapter through LSP4IJ, or use its detected adapter. Rebuild after enabling source maps so generated JavaScript and maps describe the current source.
Pause on executable code#
Set a breakpoint in a function the selected program actually calls, then choose Debug. Inspect the stack frame and local values, step over an expression, and use watches for repeated inspection. A declaration without executable work is not a useful breakpoint location.
If a breakpoint is unbound, inspect compiler version, source maps, generated paths, target, and debug-adapter startup. If it binds but never pauses, check the selected entry/package and execution path.
Keep targets distinct#
These source-level debugging instructions cover JavaScript. Choosing Erlang changes the runtime and does not reuse a JavaScript DAP session.
For distribution of a BEAM application, the documented release also supports standalone escript export from a Gleam run configuration with Gleam 1.17 or newer. Review task-specific options and output paths. An escript is a BEAM deliverable, not a JavaScript bundle, so validate it with its intended Erlang runtime.
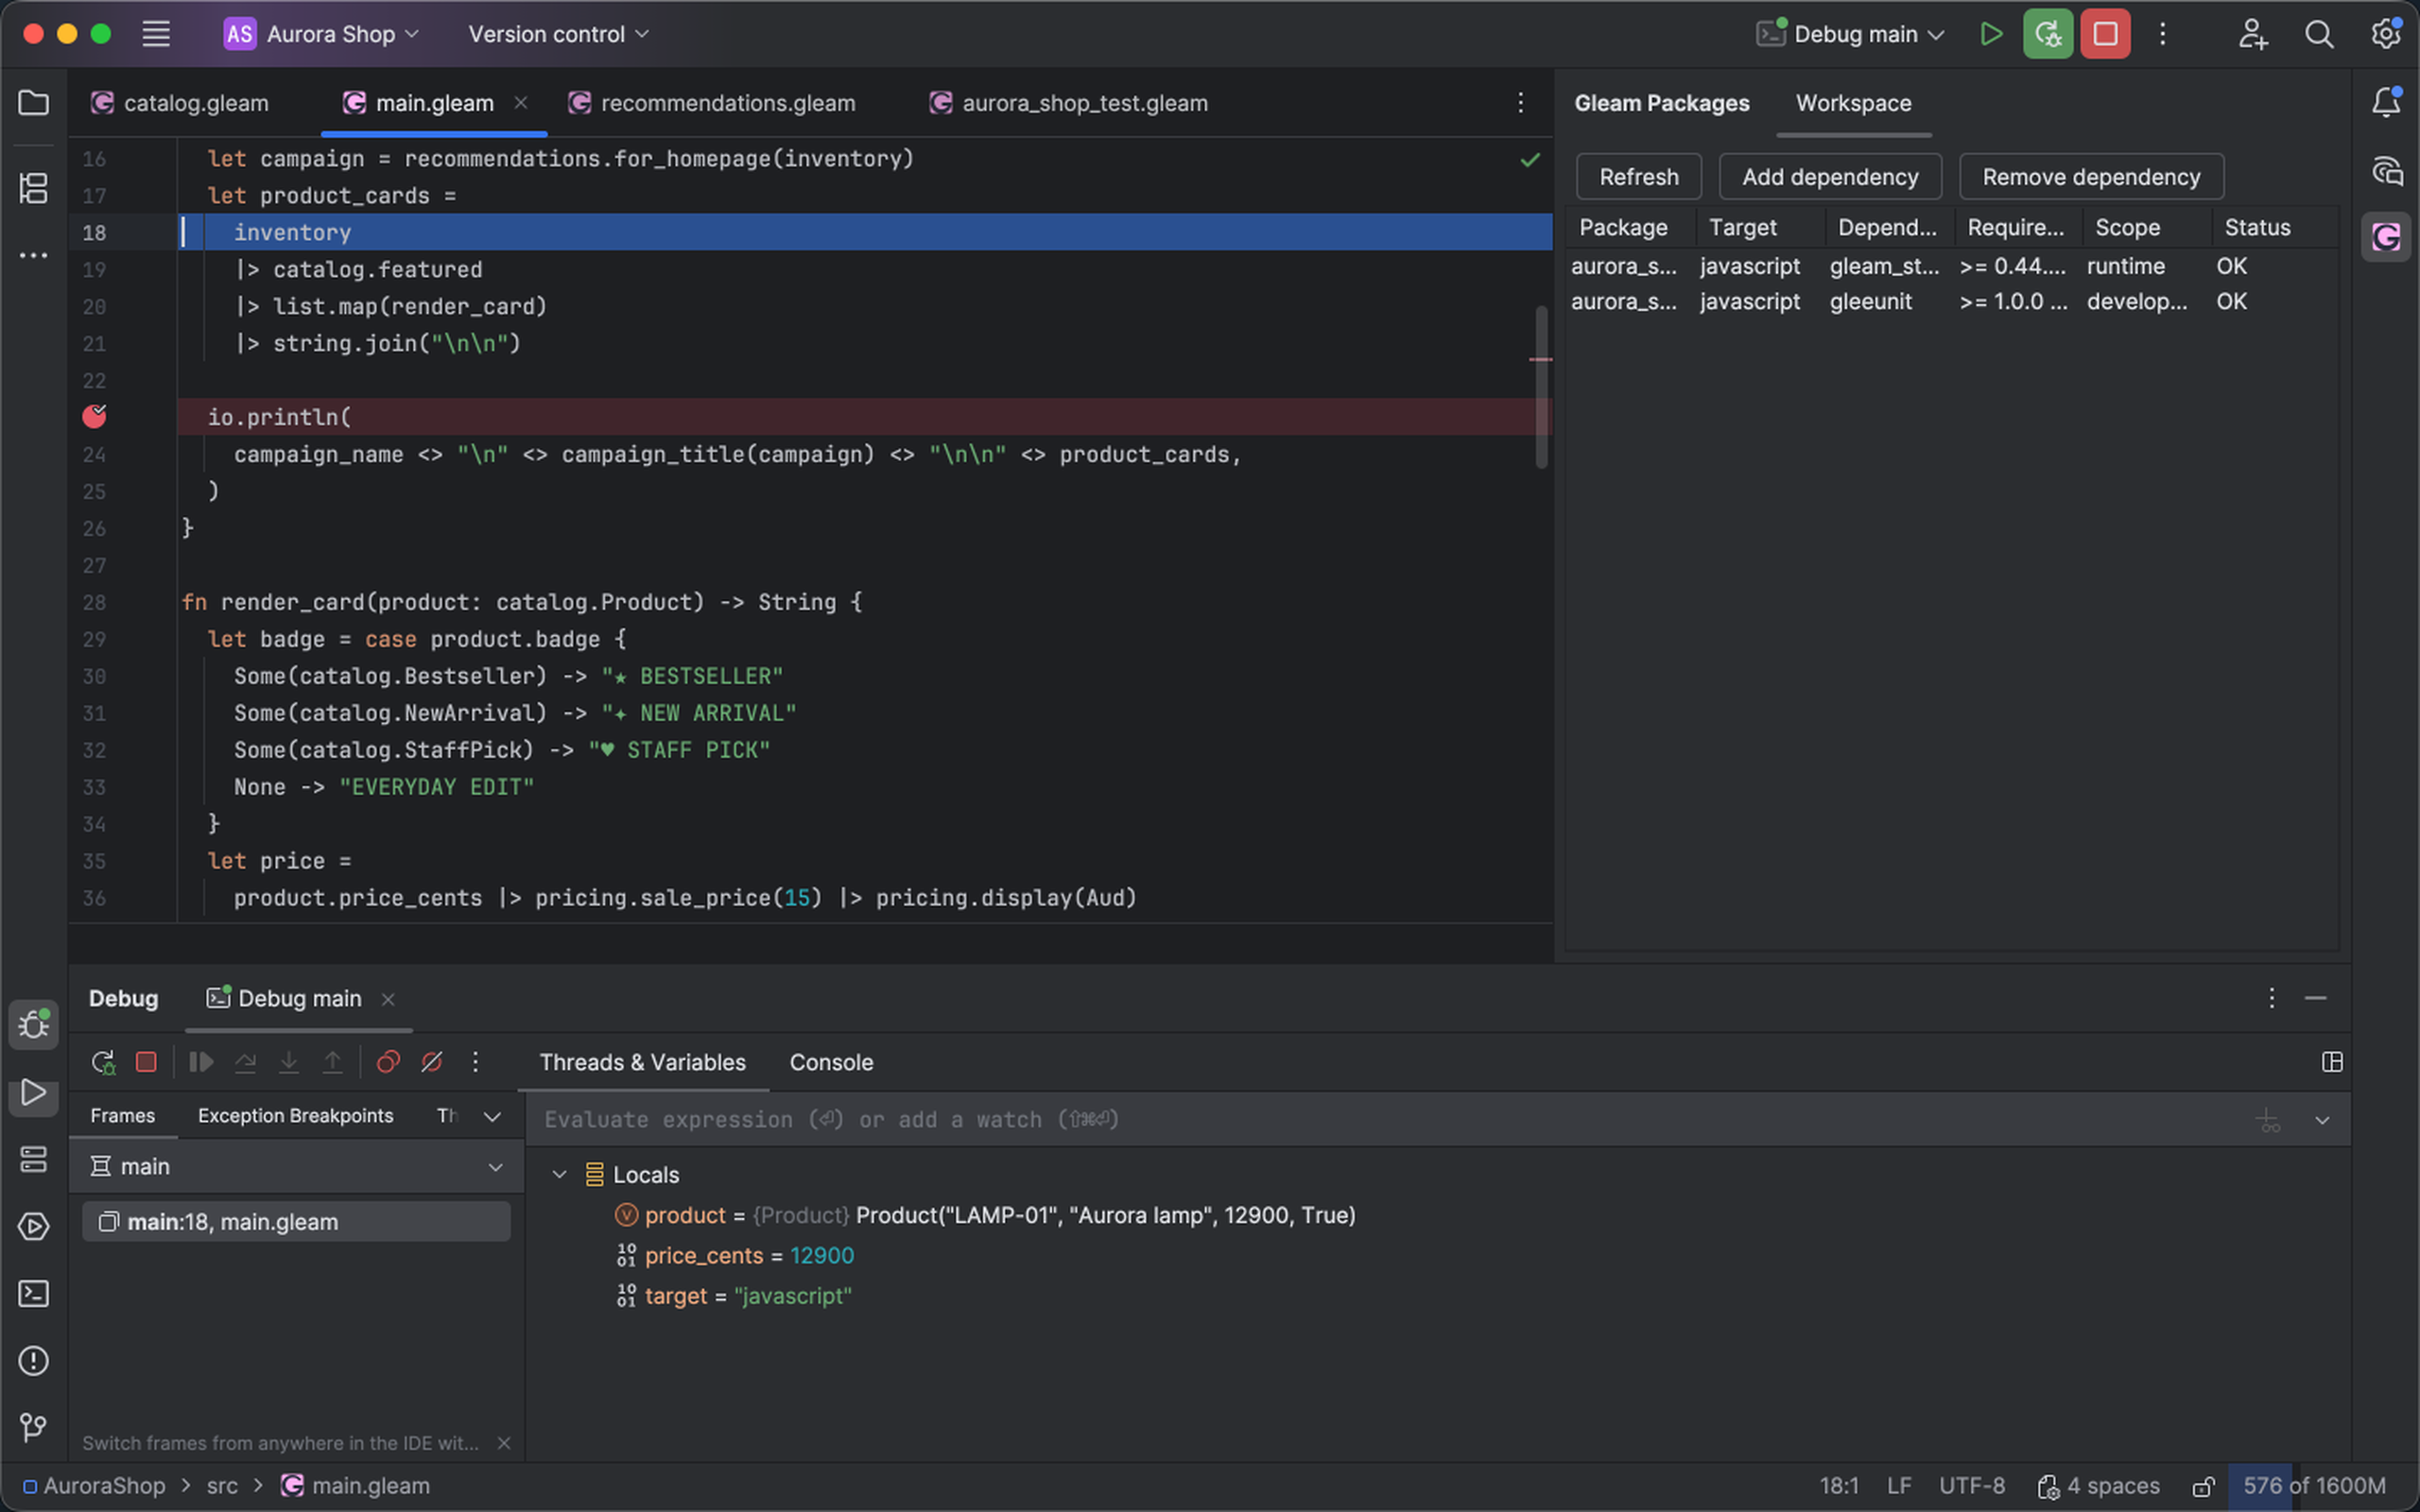
The debugger pauses in Gleam source and shows local values for a JavaScript-target run. Select the image to view it at full size.
Manual for version 2026.2.4 · Reviewed